Unfolded World
What would Manhattan look like if its extra floors were unfolded onto a map?
A model of incomplete matched NYC records, awaiting independent scientific validation. Floor space is not new land.
Loading the map…
The atlas could not load
Reload the atlasThe three steps show calculated areas. Shapes between steps are only an animation.
Matched records · incomplete inventory
Manhattan and Brooklyn
Manhattan borough and Brooklyn, on the same reported-area method. The map above shows Manhattan Island; this comparison includes all land pieces in each borough’s pinned boundary.
Scope changes here: Manhattan borough includes the Island and its other land pieces. Do not add the Island to the borough.
This control changes the borough comparison only. The island map and inspector continue to use the footprint proxy.
“Plate” means the estimated building base subtracted from recorded floor area. Footprint proxy uses the mapped outlines; Larger plate subtracts the larger of that outline or a floor-count-based estimate; Smaller plate subtracts the smaller. Same matched records, different assumptions—not uncertainty bounds.
Original land + additional recorded area
Explore individual measures
Each bar starts at zero on one shared scale. Area measures use km²; the multiplier is dimensionless. These bars compare values, not geographic shapes.
Swipe or scroll sideways to see the remaining table columns. Keyboard: focus the table and use the left/right arrow keys.
| Borough | Ground L | Extra V | Unfolded U | U ÷ L |
|---|
PLUTO 26v2 · water-excluded NYC 26c boundaries · incomplete matched subsets. The three plate proxies are sensitivities, not physical bounds or confidence intervals. Missing stock, condo area and basement coverage remain unresolved; full-stock values are unknown. Source observation epochs differ. No complete-stock ranking or crossover claim is qualified.
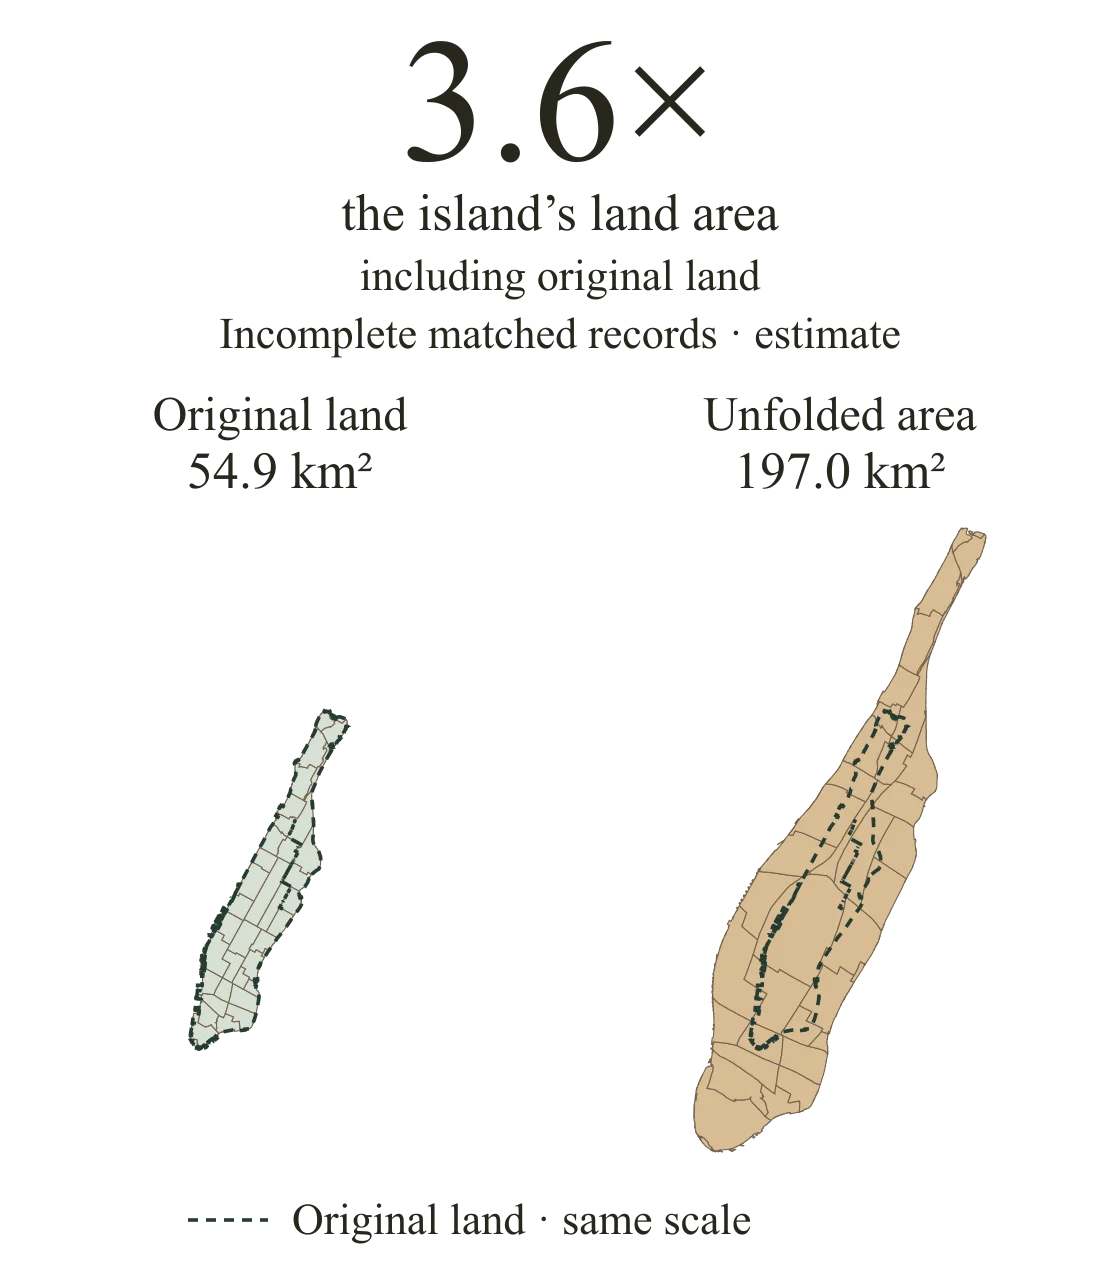
Land plus additional recorded floor area, at the same scale. Positions are distorted; floor space is not new land.
Read the quantities without the mapLive map context uses OpenFreeMap and its delivery providers. OpenFreeMap privacy policy. The local area diagram and recorded quantities remain available if geographic context fails.
Keeping the ground, unfolding the floors
Keep all the land. Add the recorded floor area after subtracting estimated building bases, so ground-level space is not counted twice.
The project links floor-area records to mapped outlines through NYC property and address records. A tax lot can contain several buildings; an outline alone cannot tell us how much floor space is inside.
Reported floor area − estimated building bases
= additional recorded floor area
159.8 km² − 17.7 km² = 142.1 km²
Land + additional recorded floor area
= unfolded area
54.9 km² + 142.1 km² = 197.0 km²
All land stays in the calculation. Reported floor area and estimated bases use the same matched records.
Read the method and its limits
What is missing?
6.1% of known reported floor area is withheld in the extracted Manhattan-borough source records. This is not an Island completeness rate or a measure of every building.
What the coverage number counts
The source records contain 170.9 km² of known reported floor area. Of that, 10.5 km² (6.1%) is in withheld groups.
4.0% of the same denominator is withheld solely because expected outlines are missing. Other groups have no matched outline, unavailable floor-area records or placeholder geometry.
These are whole source-record quantities, grouped by borough label. Missing reported values have no known area to count; they do not mean zero physical space.
More intensely built, or larger in total?
In this reported-data model, Manhattan has more modeled area per unit of land. Brooklyn has the larger modeled total.
The area ratio divides land plus additional recorded floor area by the original land area. A larger total also depends on how much ground there is to begin with.
| Measure | Manhattan borough | Brooklyn |
|---|---|---|
| Land | 59.1 | 179.7 |
| Modeled total | 201.7 | 267.9 |
| Area ratio | 3.4× | 1.5× |
PLUTO 26v2 · mapped outlines estimate building bases · incomplete matched records.
Modeled total ÷ land: Island 3.6×; whole borough 3.4×. Island and borough overlap; do not add them.
Why the Island and borough differ
The Manhattan column includes other islands, Marble Hill and all other land pieces in the pinned borough boundary.
Using unrounded values, the borough outside the Island adds 4.203 km² of land and 0.503 km² of additional recorded floor area: 4.706 km² of unfolded area. This is the included-record contribution, not a full inventory of those places.
The source check found withheld records on Roosevelt Island and Randall’s/Wards Island, including missing outlines and unavailable floor areas. The low included contribution cannot establish how much built space is actually there.
An estimate you can inspect
This is a model of matched records, not a census of every physical building. Missing records and uncertain building bases limit what the result can tell us.
When a required outline is missing, the entire linked group’s reported floor area and estimated base are withheld. Negative differences stay in the calculation as source discrepancies.
The city has another geography
The shoreline describes Manhattan’s ground. Unfolding its recorded floor space reveals a different pattern: how much of the city is stacked within that outline.
Follow it in the atlas. Land, Reshape and Unfold share one view as regions change size to represent area. The three stages show calculated areas; the animation between them is illustrative.
Release identity and technical evidence
4b46dcd50200ca7f5fa4b2d4ff7b4bf0c97318b2a67477bd41693ae4e895d128
The map, figures and evidence use one preserved research snapshot. Its internal qualification fields remain unchanged; the website presents a model of incomplete matched records, not an independently validated physical inventory.
Source and method receipts · Release manifest · Methodology JSON