← Writing
What if Manhattan unfolded?
A question about the space stacked inside buildings became an interactive map.
A few days ago, while I was working in Manhattan, I started wondering how much space people had added to the island.
The land has a certain area. But buildings let us use the same patch of ground again, one floor above another, and below ground as well. What would Manhattan look like if we could unstack those floors, lay them flat, and add their area to the island?
The total was only part of what interested me. I wanted to see where that space was concentrated, how neighborhoods would change size, and how one place would compare with another.
That question became Unfolded World, an interactive map that lets you unfold Manhattan’s recorded building floor area. You can try it before reading the rest.
A different way to draw the city
A skyline shows height. I wanted to see the accumulated area: all those floors in offices, apartments, shops, and other buildings, spread out so they could be compared with the ground.
The idea has precedents. In his 2017 essay “Do cities have a land area?”, Ben Schmidt calculated additional building floor area in New York and proposed a cartogram that would resize places by that surface area.
What I wanted to make was an interactive transformation: keep the ordinary map available, switch to the unfolded version, and explore how the places inside it change.
Counting the ground once
Imagine a simple ten-story building with identical floors. It has ten floor plates over one patch of ground. If we keep the ground and lay those floors beside it, we should add nine plates. The ground-level plate is already represented in the land.
That gives the basic calculation:
Land + reported floor area − estimated building bases = unfolded area.
Streets and parks stay in the land total. Building floors add to it after the base is subtracted. This measures horizontal area; a tall room does not contribute more merely because its ceiling is higher.
The land in this comparison is the island’s present-day land, including reclaimed ground. It is not a reconstruction of Manhattan’s shoreline before development. I began with a broad question about manmade space and ended up with a narrower one I could try to calculate: how much additional floor area is represented in the building records?
The first map
The current model starts with 54.9 km² of Manhattan Island land. Its matched records contribute 142.1 km² of additional floor area, for 197.0 km² of land plus additional recorded floors.
That is about 3.6 times the land area, including the original land. The added floor area alone is about 2.6 times the land area. Those are estimates from an incomplete set of matched records, not a measurement of every physical floor in Manhattan.
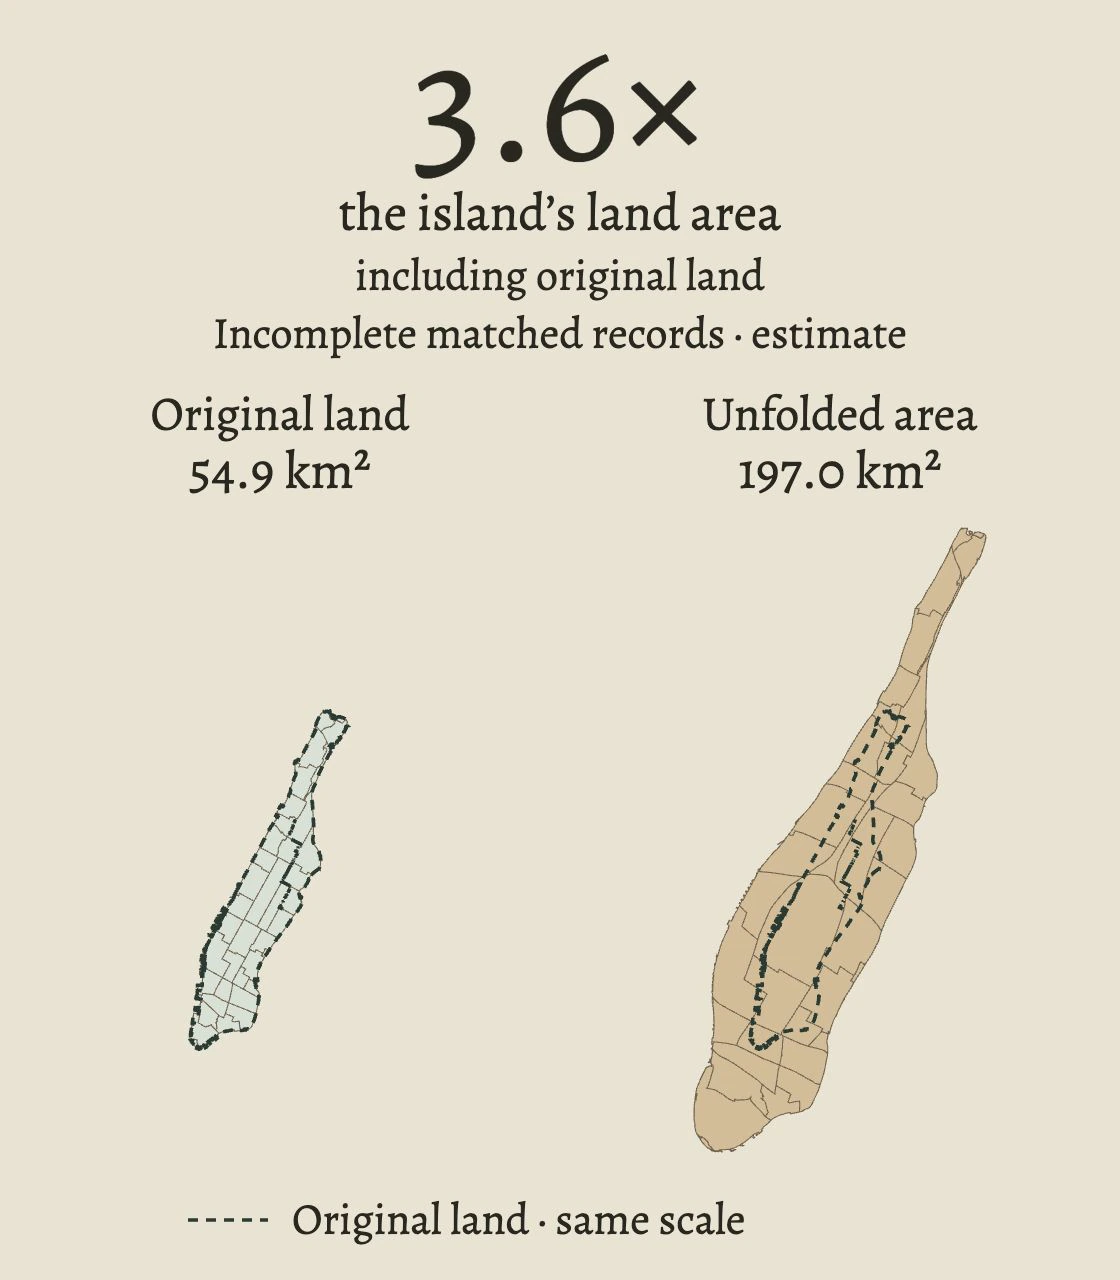
I wanted to see where that space was, too. Enlarging the island uniformly would give a park the same proportional increase as a neighborhood full of buildings.
The atlas therefore has three stages. Land shows the geographic island. Reshape redistributes its displayed area according to the modeled land-plus-floor-area totals, while keeping the island’s total displayed area unchanged. Unfold expands that reshaped island to represent the larger total.
Financial District–Battery Park City, for example, reaches about 6.8 times its land area in the model. Central Park contributes no additional floor area in the included records: its land still counts, but it takes up a smaller share of the unfolded island as the built neighborhoods grow. The original outline remains visible so you can compare the two.
The result is a cartogram: a map whose regions are resized to represent a quantity. Distances and positions become distorted. The endpoints have calculated area targets; the motion between them is an illustration. You could not navigate the unfolded city with it.
What the records leave out
The arithmetic fits on one line. Deciding what belongs in that line takes more work.
The model combines reported building floor area from PLUTO 26v2, New York City’s property-lot dataset, with mapped building outlines. A tax lot can contain several buildings, and a building can connect to more than one lot. Those identities have to be matched before their areas can sensibly be subtracted. Where required records are missing, the current model withholds the linked group’s floor area and building-base estimate together, while keeping all the land.
Those matching rules withhold 6.1% of known reported floor area in the Manhattan-borough source records. That measures omissions from those borough records, not how completely the model accounts for Manhattan Island or its physical buildings.
Underground floors belong in the unfolded city too, but the current records do not consistently account for all that space. Unrecorded floors could add to the estimate; overlapping property records could count some space more than once. Overhead outlines are also imperfect estimates of ground-level floor plates. I have not established the combined effect of these problems, so I cannot yet say how far the model’s total is from a complete floor-area inventory.
The atlas keeps the quantities behind this snapshot (CSV) and the method and limits available alongside the map. The distinction matters to the idea itself: an animated shape can look much more certain than the records behind it.
Bigger in which sense?
Brooklyn made the comparison more interesting.
Comparing unfolded Manhattan with Brooklyn’s ordinary land area asks one question. Unfolding both boroughs asks another.
In this snapshot, Manhattan borough has 59.1 km² of land and 201.7 km² of modeled land plus additional floors, a ratio of 3.4×. Brooklyn has 179.7 km² of land and 267.9 km² modeled, a ratio of 1.5×. Manhattan has the higher ratio, while Brooklyn has the larger modeled total. More intensely built does not necessarily mean larger in total.
The comparison uses the whole borough, which includes land beyond Manhattan Island. The atlas keeps those scopes separate; the island is part of the borough and cannot be added to it.
Beyond Manhattan
The same view could extend to other cities and to a globe whose regions change size with the space built inside them. A historical version could show how that geography changed as buildings went up and came down.
Those views would need comparable records. A historical map would have to account for buildings that disappeared, rather than relying only on the construction dates of buildings still standing. A global sum of all floor area would also answer a different question from the additional area left after subtracting building bases.
I want the atlas to improve as the evidence improves. A corrected measurement should flow through the map, comparisons, and explanation together, so each view describes the same version of the city.
For now, Unfolded World is a Manhattan research atlas with a Brooklyn comparison. It gives me a way to examine the question that started it:
When we build upward, how much horizontal space do we put inside a place whose outline on the map barely changes?
Explore Unfolded World
The space stacked inside Manhattan.
Open the atlasTopics: cartography, cities, research